K-Compare Suite – When it comes to data translation, many systems mark their own homework. But what if you need to be able to compare data from two sources, identify any differences and document changes? We look at what Kubotek has to offer
The process of translating 3D CAD data is one that, on the surface, appears to have become less fraught in recent years.
As vendors have better embedded data translation capabilities into their systems, and component providers have built up a set of robust and intelligent tools, you’d be forgiven for thinking that, in most cases, data translation is a done deal.
But when you start to consider real-world use cases, you’ll quickly discover that it’s still a problematic process.
Yes it’s true that everyday translations probably work better than they did traditionally. But in edge cases, the movement of data between incompatible systems, particularly complex and large-scale ones, is always going to throw up issues.
Additionally, there’s also a need in some industries (say, aerospace or automotive) for data translation to be validated once complete. In other words, companies in these industries don’t just rely on the automatically generated translation log with which we’re all familiar.
The translation process needs to be properly verified and validated.
On top of all of this, there’s also the issue of change management. As the 3D model becomes the lingua franca of production, with 2D drawings providing associated documentation and GD&T or providing data that is embedded in the 3D model using a model-based definition (MBD) approach, we need to ensure that changes between different versions of the same part (note: part, not model) are first identified and then documented.
It’s into this environment that Kubotek has stepped with two tools: K-Compare Revision and K-Compare Validate. Here, we’re going to look at both individually, starting with the more broadly applicable K-Compare Revision.

K-Compare – Investigating design change
K-Compare Revision is simple to use. You load up the two datasets you want to compare. The system can read data from standards-based formats such as IGES, STEP, JT et al.
It can also read data from Solidworks, Solid Edge, Inventor, Catia, NC, Creo, Catia (V4 to V6), as well as kernel-level formats such as Parasolid and ACIS.
If you have two parts in different orientations (perhaps one has been output for manufacturing readiness, while another is in assembly space), then there are tools to align them as well.
The system then carries out its analysis of both and presents the findings on screen.
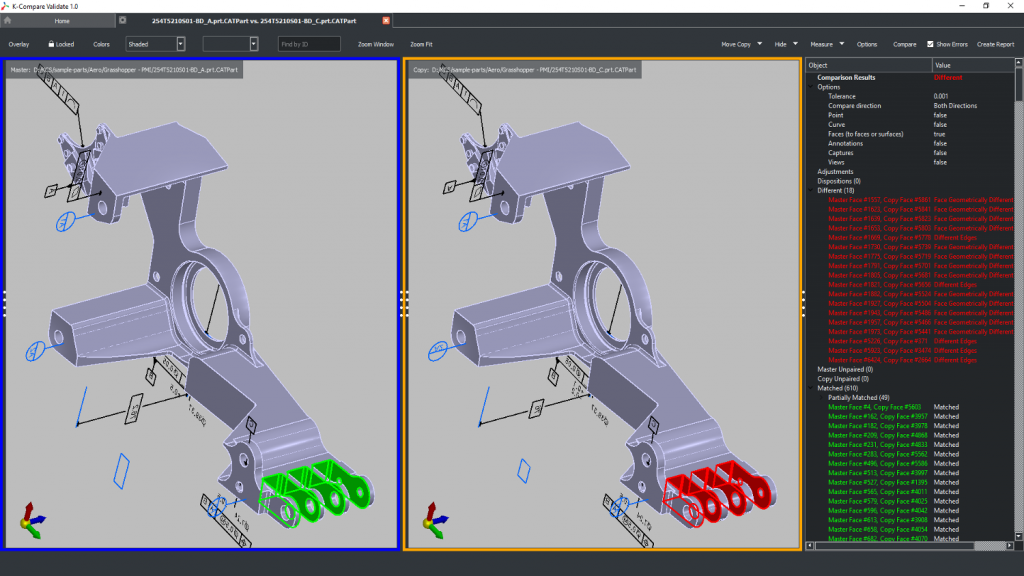
The two datasets are presented in side-byside, synchronised model windows, with a more textural dialogue to the right.
This will list out the content of those two parts, face by face, volume by volume, annotation by annotation and group them in a sensible manner. It also identifies parts that have moved (but retain the same face reference) and any areas that are missing.
This description perhaps underplays the complexity of what the system is actually doing behind the scenes. Rather than relying on geometry kernels from other vendors and different translation providers, Kubotek has used its experience in geometry wrangling and data translation to build its own geometry engine. This is designed to read data from almost any source and gives the company a huge advantage, as well as a position of independence that is really key.
Other mainstream engineering design tools may now have part-comparison tools of their own, but these effectively carry out Boolean operations to find areas that are different, moved or missing. Kubotek’s approach to analysis is much more in-depth.
When your two parts are loaded, you can then use a combination of the interactive dual viewport display, the textural browser and dynamic highlighting on the geometry to explore how the two parts differ. The system helps this process along by carrying out both a categorisation of the faces (face, fillet, hole, chamfer) and grouping them into folders marked ‘Revised’ (which is a size or positional change), ‘Removed’ and ‘Added’.
As you explore these changes, it’ll very quickly become obvious that a number of those faces belong to a single feature that has been modified, added or removed.
The system allows you to group these faces together into a single feature with a more sensible name in the exploration window. Alongside all of the geometryrelated tools, K-Compare Revision also has the ability to do the same work, but with PMI (product manufacturing information), model-based definition (MBD) data – as you may have guessed from previous references to annotations.
K-Compare Revision treats PMI data as separate from the geometry and puts these entity types in their own branch in the tree.
It performs a semantic entityto- entity compare in the same manner as it does with geometry, and then lists and displays differences via the same interface methods. If the system has any trouble reading these differences, they will be highlighted and listed in a ‘Review’ folder for manual investigation. At present, the system supports PMI data from Catia (V4 and V5), PTC Creo, Siemens NX and Solidworks.
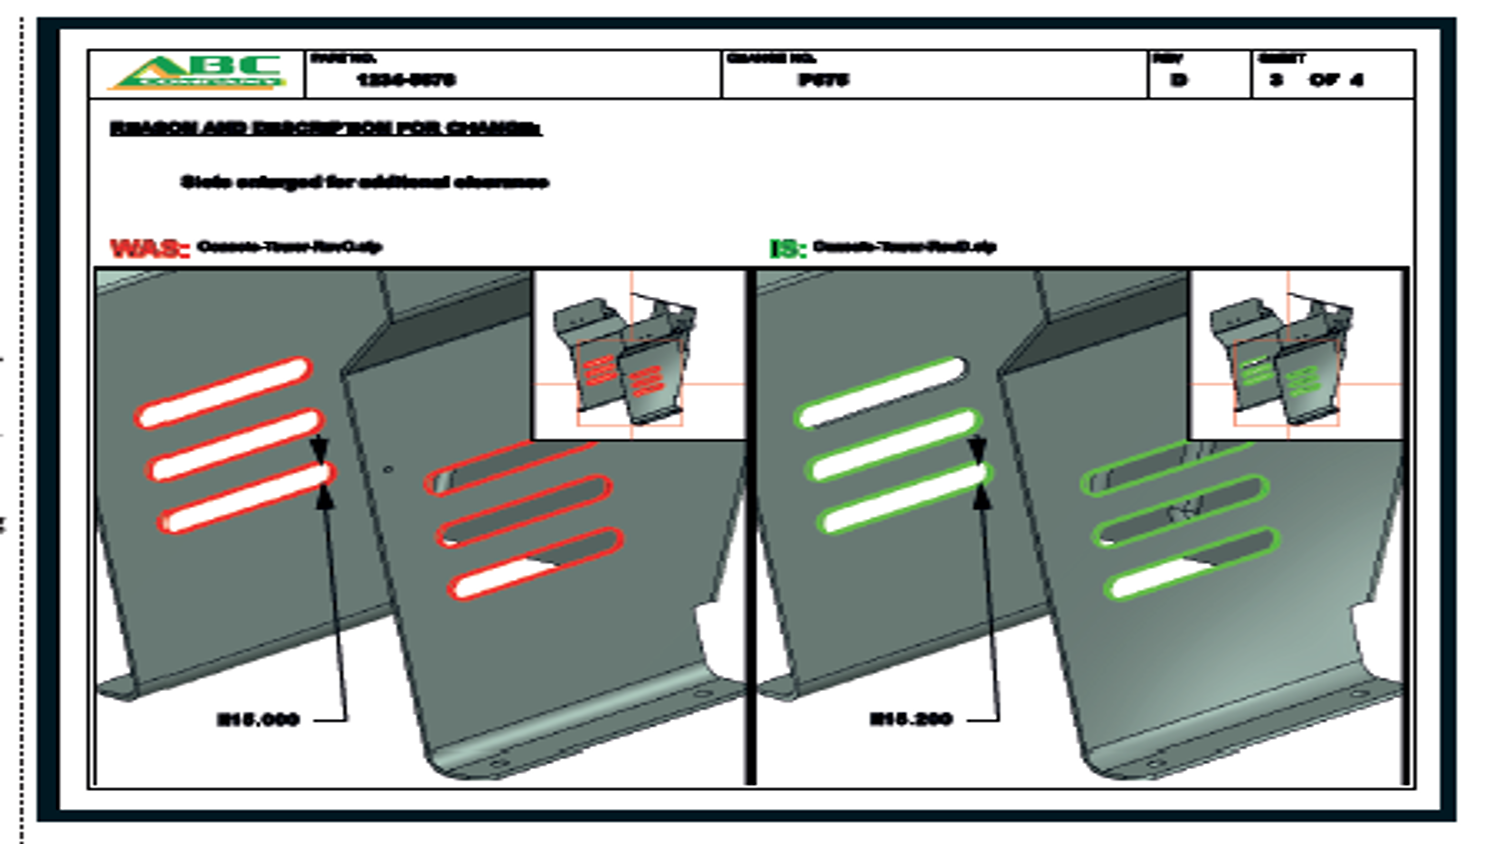
It’s also worth considering the documentation process, which will require an image to show the change. To make this more efficient, it’s a good idea to get your models into a useful position/orientation and hit the ‘snapshot’ icon next to the face or feature group. This will record the model orientation at that moment. At the same time, you can also add explanatory notes to each change found in a very similar manner.
As you’ve probably guessed, the final step in the process is to create some documentation based on your findings. K-Compare Revision includes a pretty slick set of report generation tools. It’ll take the snapshots you’ve already defined, along with any notes and use these to build a fully configurable report that can be stored and shared when needed.
Interestingly, the reports aren’t static. Instead, they include dynamic, interactive 3D images. At any point, you can edit these, even add labels and other mark-up notes. These reports can then be stored in the native SVG format or exported to formats such as PDF as needed.
K-Compare – validating data translation
While K-Compare Revision handles the process of comparing two data files to find changes as a result of design change, K-Compare Validate is intended to provide an environment for comparing the results of data translation.
Why would you need to do this? The fact is that, as you move data from one format to another, errors can creep in.
While in many industries, this issue is rarely addressed, others are hotter on the subject. Aerospace is a perfect example and it’s quite often a legacy of the adoption of earlier 3D design and engineering systems, where translation issues were much more prevalent. If you want to see how concerned some OEMs are about this issue, just take a look at Boeing’s D6-51991 Rev N standard.
So, what does Kubotek’s system do? The workflow is similar to that previously discussed. The primary difference is that, instead of looking for differences in two different sets of geometry, we’re looking to ensure that two sets of geometry that document the same part are exactly the same. You load the originating part in its native format and then the translated part – whether that’s to a standard, neutral or native format.
The system then carries out the same analysis, looking for any discrepancies between the two. With the Revision variant, the next step is to explore these differences; with Validate, by contrast, you’re looking to document whether the translation process was 100% accurate. If not, you’re going to need to document where discrepancies lie.
Also, because of the go/no-go nature of validation testing, K-Compare Validate does not provide the basic feature recognition seen in K-Compare Revision. It only works with face-to-face comparison.
As a result, the reporting process is more rigid and protected. The system can output reports, based on your own customised templates, but these are certified Quality Documents or Test files.
These will contain all of the text you need, as well as any images you’ve added into the port as well. Both the text and PDF versions of these documents are then locked and made read-only, so they can’t be tampered with, which will help with compliance and traceability issues in more sensitive environments.
In conclusion
Both of Kubotek’s systems covered here are first class. They’ve been developed to serve a specific purpose – and they carry it out without fuss or overcomplexity.
While the need for compliance and validation of data translation is always going to be a more niche requirement, driven by industry-specific and supply chain requirements, there are huge benefits to be had by a wide audience from the use of an independent, third-party set of tools for data comparison and design change evaluation.
Kubotek’s history and expertise in CAD development has clearly helped it develop a set of tools that excel in performing this work. They also operate outside of the closed environment of CAD system verification and reporting. If you have a need for this kind of capability, I’ve no hesitation in recommending you take a look at these tools.


