In keeping with our recent work on principal stresses then we should be happy that the most simplistic (and useful) view of ‘stress’ is that of three direct stresses (tension or compression) acting perpendicular to each other. Remember that these direct stresses act alone (no shear) as long as we look at the principal directions.
Remember also, that on any un-pressurised external surface, the general 3D stress state reduces to that of a 2D stress state (two in-plane principal values only).
If we now think about a sensible test to examine how things break then it’s not a massive leap to consider a cylindrical component (or test piece) under tension. We understand that straight tension is a key component to our new-found view of stress.
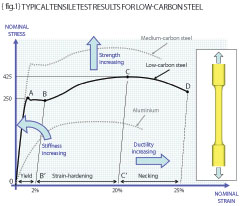
The inset in {fig.1} shows such a machined test piece and if we accept that it is made from low-carbon steel then the stress versus strain response is shown graphically between points O-A-B-C-D. The stress measure here is the nominal stress (force/original area) and the strain is the nominal strain (change in length/original length). The local gradient is analogous to the stiffness of the material (observe that the stress-strain curve for aluminium has a lower initial gradient than that of the low-carbon steel).

The tensile test reveals a very stiff (high gradient) elastic portion (O-A); a “yield” portion (A-B) where the stiffness is almost zero; a “strain-hardening” portion (B-C) where stiffness increases once more; and a “necking” portion (C-D) where the gradient is negative leading to failure at point D. The portion of the curve O-A is where Hooke’s law is obeyed (stress is proportional to strain) and the material behaves in an elastic fashion (removing the load will return us to point O).
As long as we draw nominal stress versus nominal strain then we will observe a natural maximum in the curve (point C) and that point is defined as the “Ultimate Tensile Strength” (UTS) of the material. The low-carbon steel therefore can be characterised by the Yield stress (point A), the UTS (point C) and the gradient of the elastic portion (O-A) which we should know as the Young’s Modulus of the material. We will need a measure of how the lateral strains relate to the longitudinal strain and this is taken care of by the Poisson’s ratio (so look this up for homework).
Staying with {fig.1}, remember that gradient is proportional to stiffness, height is equal to increasing strength and width is equal to increasing ductility. Be aware therefore that calling for increased strength (say the use of a medium-carbon steel over that of low-carbon steel) will also reduce the ductility (thus make your material MORE brittle). A good common-sense engineer should know that the energy required to fracture any given material will be proportional to the area under the stress-strain curve. Materials like mild steel require enormous energies (work of fracture) to cause fracture (say 105 to 106 J/m2) whereas a brittle material will require much less (typically 102 J/m2 or less).

Now let’s return to our header tube example from the June issue of DEVELOP3D – a tube with a torque of +320E6 Nmm applied at one end and -320E6 Nmm at the other. {fig.2} (inset) shows the tube in force and moment equilibrium with a graphing line identified along the axis of the header through the brace. We showed that the shear stress on the outside surface would be 250MPa (from torque times radius divided by the polar second moment of area) and that the resulting principal stresses were +250MPa at 45-degrees to the axis and -250MPa at 45-degrees to the axis the other way. Given that the yield stress of the tube was 500MPa with an elongation at failure of say 25% (therefore NOT brittle) then we CANNOT just compare P1 and P3 with the yield. What we need therefore is a “Yield Criterion” – this is merely a “recipe” that instructs us how to combine stresses together in such a way that we can compare the result with yield.
{fig.2} shows the graphical variation of the principal stresses on the outside of the tube (+250 and -250MPa as expected) but importantly the von Mises failure criterion that COMBINES all the principal stresses such that we do have a number to compare with yield. The von Mises variation shows that yielding will occur near to the brace penetration but not in the majority of the main header.
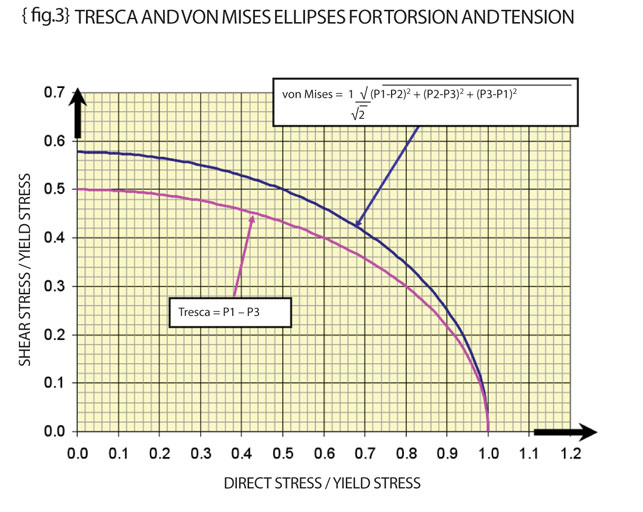
Finally {fig.3} gives the “recipe” for the von Mises failure criterion in terms of the Principal Stresses, P1, P2 and P3. A simpler “recipe” was concocted by Tresca (the difference between P1 and P3 taking account of sign) and both these relationships are shown graphically on {fig.3} for the case of mixed tension and torsion.
The chart illustrates the important engineering fact that shear (combined tension and compression in principal planes) causes yielding at a lower stress magnitude than that of tension acting alone (about a factor 2). More next time…
R P Johnson BSc MSc NRA MIMechE CEng – technical director, DAMT Limited

Part six of an engineering master class, this month: Yield Criteria