As you will have read previously, we have been taking a look at the wide variety of tools available for designers and engineers to assess the environmental impact of their products. This month it’s the turn of SolidWorks Sustainability, a life cycle assessment (LCA) tool for SolidWorks that offers cradle-to-grave analysis of products.
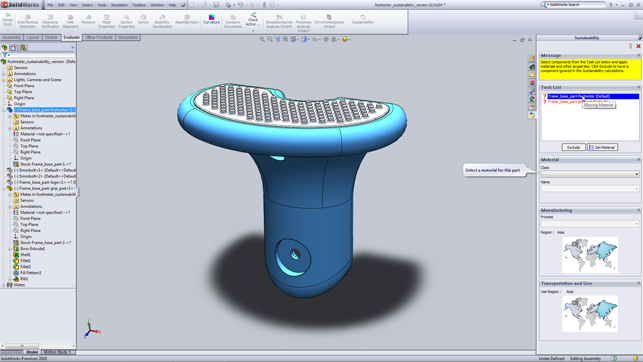
When loading an assembly, Sustainability checks to ensure all parts have materials applied and presents a list of those missing input. These can selected from an extensive database. Once finalised these can also be sent to the source SolidWorks part file
SolidWorks Sustainability was first introduced last year with SolidWorks 2010 in the form of SustainabilityXpress, a functionally restricted version of the software designed to give users an insight into the technology and process surrounding sustainable design. The tool allowed the evaluation of single parts and also restricted which information could be gathered and reported upon.
The company has now followed up this release with the full-blown version of SolidWorks Sustainability, which is the subject of this review. This allows the evaluation of assemblies, but also extends the set of input and reporting functions that are available, as we’ll shortly discover.
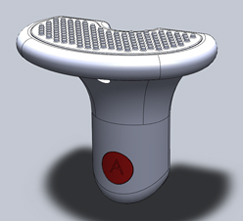
Manufacturing, transportation, usage and energy requirements are added to each part to give the system the context in which to calculate the impact of each part
The test drive
The best way to explain how the system works is to track the design of a fictional product, one that is currently manufactured and sold in Europe, but in order to decrease costs and extend the market to North America, the production is being moved to China.
The product assembly is relatively simple – three custom parts and two fasteners, all of which are designed in SolidWorks 2010. To begin with, it’s really a question of hitting the Sustainability icon, which is found in the evaluate ribbon panel. This loads up the system, which is then interacted with through the task pane to the right of the user interface.
The first thing the system does is to check the assembly to see if all the materials have been defined. If a part doesn’t have a material assigned it is listed and you then choose a material from the huge material library. These are defined by class (such as plastics, rubber, and metals) and then by specific material.
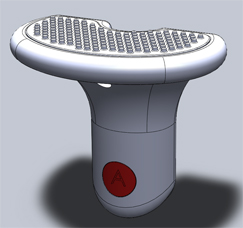
The results are presented in the lower portion of the Task Pane, with seperate charts that breakdown the consistent impact of material, tranportation and use, end of life and manufacturing – these are further segmented by key environmental concerns (such as air and water pollution, carbon output and energy consumption
As Sustainability encourages material experimentation, it doesn’t automatically update the part’s material until the Set Material icon is pressed.
The next stage is to define the manufacturing factors associated with the part. This includes the region that it will be manufactured in – Asia, Japan, Europe or North America – and the process that will be used in the manufacture, such as machining, injection moulding etc.
The user then defines where the product will be transported to and used with a region chosen from a list or selected from a map. The predominant method of transportation also needs to be chosen, from train, truck, plane or boat. The final optional input is the energy used in the product’s lifecycle.
As soon as this information is complete, the results start to stream in. These are presented at the bottom of the task pane in the dashboard and initially consist of pie charts showing the environmental impact of the product, broken down into four areas including carbon footprint, energy consumption, air pollution (which refers to contribution to acid rain) and water eutrophication (which is the over abundance of nutrients in water that kills local life).
In each chart the user can drill down further to look at the impact of material choice, manufacturing, transportation and use, plus end of life. Baselines can be set so that any further experimentation can be gauged against the starting position – which is going to become handy in the next step.
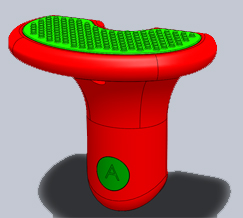
Assembly visualisation and evaluation tools allow the user to graphically display key contributors to various ecological impacts
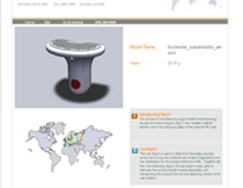
Below the charts there are a series of icons, which can be used to generate a Word-based report that contains all of this information. While the report is fully customisable, most users will probably cut and paste this information into their own format reports. Alongside the reporting functions, a useful tool allows users to colour components within the 3D assembly by any of the sustainability inputs or outputs. This makes it easy to identify critical values, for example, according to the manufacturing location, process, or material. These can also be combined with standard properties, such as mass, volume or even cost, if it is stored as a property.
Another cool visualization capability is being able to take quantity into account, so if, for example, there are a hundred small components, their collective impact is measured.
In relation to our example product,The visualisation tools show that the large component has the greatest environmental impact and the material of the product makes up the largest portion of that impact (see Figure 6). This is where the materials selection tools come into play.
The impact of change
The next stage it to explore the impact of change and this is where SolidWorks Sustainability excels. Alongside the environmental impact tools, the software includes a set of material exploration tools and an associated library. While the existing SolidWorks material library was pretty comprehensive (it has to be for the sake of the simulation tools), it has been reworked to now include additional data, branded plastics DIN support and more.
The find similar materials tool allows the user to find similar materials in relation to an initial choice based on a wide variety of structural performance criteria
Using this as the backbone, the ‘find similar materials’ button brings up a dialog that extracts the material characteristics from the existing selection (such as tensile strength, elastic and shear moduli, Poisson’s ratio, thermal conductivity, density etc) and allows the user to filter the database with Boolean ranges (equals to, greater than, less than specific values). This presents a list of matching materials, which, regardless of any sustainability issues can be incredibly useful in its own right.
The results can be sorted by specific value, sub filtered and investigated. What’s interesting is how the same environmental impact pie charts are available for each and the user can immediately see if they are an improvement on the existing selection. In our example, it became clear that a different material (swapping ABS PC for plain ABS) would match our functional requirement and also improve the environmental impact at the same time.
The baseline tools can also offer benefits when working on design change or product refresh work. Today many organisations are looking to gain competitive advantage by improving the green credentials of their products. The baseline tools allow the user to experiment with a product’s performance or play with different configurations. Baseline data can also be imported from another product assembly and used as the basis for comparison to help find percentage improvements that meet set goals.
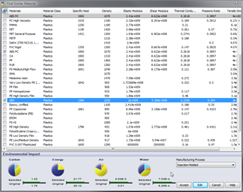
Figure 6
Conclusion
There are an increasing number of green design/environmental impact tools and these can generally be split into two categories: compliance and Life Cycle Assessment (LCA). Compliance deals with the business end of the design process and is used to ensure that products don’t fall foul of increasingly tough national and international regulation of substances. LCA is used throughout the design process, and measures a range of environmental impact categories. It is often seen as the ‘warm fuzzy’ end of sustainable design, where the green magic happens.
SolidWorks Sustainability is firmly ensconced in the LCA camp and the way it’s integrated into the 3D design system makes it a true designers tool. It allows users to gauge the effect that products will have on the environment and with support for assemblies and extended functionality is much more capable than the Xpress version, which every SolidWorks user has access to.
The most powerful aspect of SolidWorks Sustainability is the fact that it becomes part of the design process, from materials selection, through to the ability to visualise key contributors and compare design variants. Only by integrating these types of tools into the workhorse design tools we use every day can they gain traction and become part of the workflow – and SolidWorks has made a bold move towards achieving this goal.
| Product | SolidWorks Sustainability |
|---|---|
| Company name | Solidworks |
| Price | from $3,000 |


