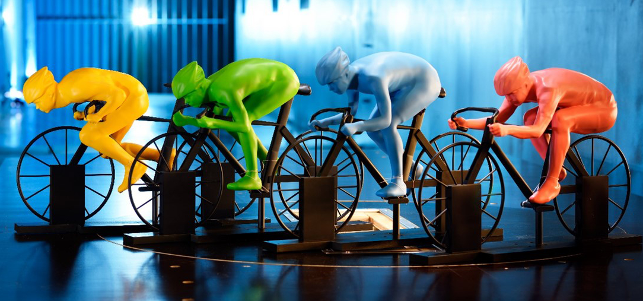
In order to test the various descent positions in the wind tunnel 1:4 scale models were made
Those who watched last year’s Tour de France may have noticed the curious position that UK cyclist Chris Froome adopted when he descended the Peyresourde during stage eight of the competition.
He broke away from his competitors just before reaching the 1,569m summit and then descended the 15.5km towards the finish line to win that stage by 13 seconds. Whilst doing this he was effectively sitting on the crossbar with his chest on the handlebar, placing the bulk of his weight on the front wheel.
Surely, this was a dangerous descent position but was it worth it to make him more aerodynamic? When questioned by the press afterwards and asked whether he or Team Sky had practiced it beforehand, Froome answered, “It was really just a spur of the moment thing. I felt like a kid again, just trying to ride my bike as fast as I could.”
Bert Blocken, professor of aerodynamics at both Eindhoven University of Technology (TU Eindhoven), The Netherlands, and Leuven University, Belgium, was watching this stage of the race and within ten minutes he’d received two emails from colleagues and one from Thierry Marchal, Ansys’ global industry director for sports, medicine and construction, all suggesting that they investigate this particular descent position to uncover whether it really is aerodynamically superior.
So an independent and unfunded collaborative research project was put together with Blocken as project leader, Thijs van Druenen and Yasin Toparlar, both PhD students at TU Eindhoven, Thomas Andrianne, lecturer in aerodynamics and director of the wind tunnel laboratory at the University Liege, Belgium, and Marchal of Ansys.
The project team would compare Froome’s position to that adopted by other professional cyclists in several races.
There would be four in the study namely: Position Froome; Position Pantani (from the late Marco Pantani); Position Back Down (from Vincenzo Nibali); and Position Back Horizontal (also from Vincenzo Nibali, and one that is adopted by many cyclists whilst descending).

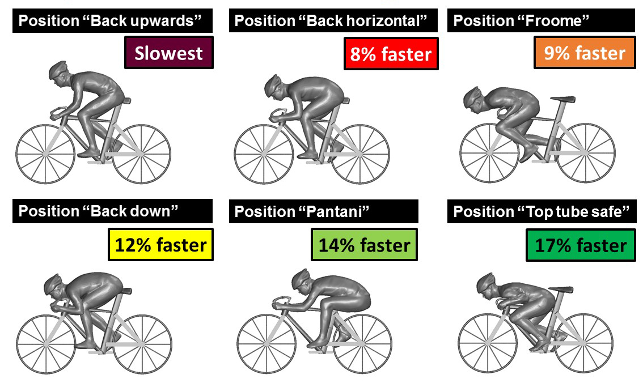
Comparison of six positions in terms of speed, either without pedalling or when all cyclists are pedalling with the same power provision
Let the investigation begin
Two different methods – wind tunnel testing and CFD – would be used to carry out the investigation, both based on the assumption that none of the cyclists would be pedalling.
For the wind tunnel testing, a cyclist was scanned in these four positions and the data was then used to create 1:4 scale models that were cut using CNC technology. “The tests were performed at 216 km/h for Reynolds similarity with the physical reality at full scale and 54 km/h (= 15 m/s). 216 km/h is a hurricane of category four, so the models needed to be reinforced with vertical bars in the wheels.
Corrections were made to remove their contribution to the aerodynamic resistance,” describes Blocken.
It was calculated that Position Pantani was aerodynamically superior being 4.8% faster than Position Froome. Then it was Position Back Down, which is 2.4% faster, Position Froome, and lastly, Position Back Horizontal, which is 0.5% slower.
In the second method, these four positions were analysed with Ansys Fluent CFD software using extremely high-resolution models of 36 million calculation cells with a near-wall cell size of less than 20 micrometers (=0.020 mm) close to the body of the cyclist.

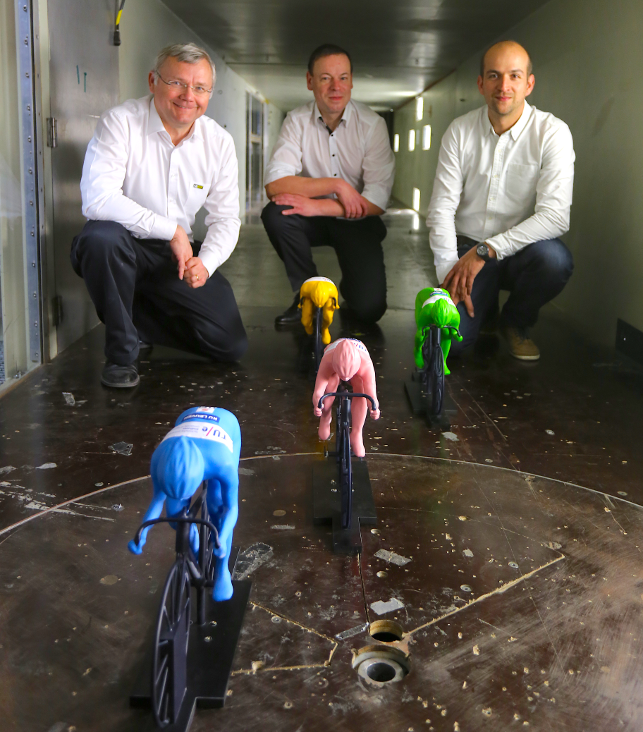
Three members of the project team with the scale models in the wind tunnel at Liege University, Belgium. From left: Thierry Marchal, Bert Blocken and Thomas Andrianne
Adding to the study
As the two methods produced very similar results, the researchers decided to add a further two positions to the study:
Position Back Upwards (from Fabian Cancellara) and Position Top Tube Safe (from Peter Sagan and so called because, as opposed to Position Froome, the body weight is distributed more equally over both wheels).
In the final results, most of the percentages are larger than the deviations between the wind tunnel and CFD results (see graph opposite). Why is this? Well, according to Blocken, the aerodynamic resistance or drag force is determined by an equation in which four factors are discerned: the cycling speed, the frontal area of the cyclist, the drag coefficient of the cyclist and the air density.
“Assuming the same cycling speed and air density, the frontal area A and drag coefficient Cd remain. The higher the values of A and Cd, the larger the drag force.
“The main reason for the difference in results in this study is the different drag coefficients. The drag coefficient is the result of the pressure distribution on the body of the cyclist.
“The pressure distribution in all positions tested is very complex and very different and this difference causes the varying drag forces,” he explains.
Although the researchers cannot recreate the exact Peyresourde descent with all the time differences between each competitor, based on Froome’s average speed during this descent (62.5 km/h), they have estimated how much time can be gained in each position purely from an aerodynamic point of view:
Position Back Upwards: +1 min 17 secs
Position Back Horizontal: + 8 secs
Position Froome
Position Back Down: – 23 secs
Position Pantani: – 46 secs
Position Top Tube Safe: – 1 min 7 secs
Final conclusions
The ultimate conclusion from all this hard work (and it was hard work as it took the team 10 months to get reliable and highly accurate results, both within the wind tunnel and CFD) is that Position Froome is not faster, not safer and not more powerful compared to other positions. And the reason why he won stage eight is because he accelerated before the summit and already had a substantial lead when he started descending and so increased his lead until his competitors started descending.
Additionally, the chasers had adopted non-aerodynamic positions (mainly Position Back Horizontal) once they started descending.
“So, yes, Froome’s position was more aerodynamic than that of the chasers, but not aerodynamically superior allround. Descending ‘Back down’ or ‘Top tube safe’ would have allowed the chasers maybe to catch up with Froome and prevent him from winning,” concludes Blocken.
Uncovering the most aerodynamic cycling positions
Default


