The condition known as “plane stress” can be a useful approximation to reduce the dimensionality of a three-dimensional (3D) problem to that of a two-dimensional (2D) one. The condition is applicable to
thin plates (with in-plane loading) where the throughthickness stress is considered small in relation to the in-plane values.
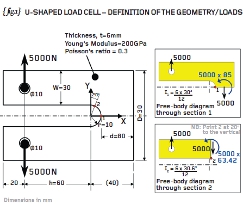
{ fig.1} shows a U-shaped load cell. The load cell comprises a 6mm thick steel plate (120mm wide x 80mm deep) with a 20mm slot cut out of the centre. The slot incorporates a root radius (r) of 10mm. Loading consists of 5kN applied to the two 10mm diameter bores.
The same problem is featured in Roark’s “Formulas for Stress and Strain”. The plate dimensions here have been set such that D=W=3r=30mm and h=3/4D=60mm so that the stress concentration factors, k1 and k2, reported by Roark are 1.72 and 1.59 respectively. These stress concentration factors define stress multipliers at positions 1 and 2 (see { fig.1}) where the background stress is given by the usual expression for the bending stress My/I.
{ fig.1} shows the free-body diagrams for sections through positions 1 and 2 and these give rise to nominal bending stresses of 472MPa and 338MPa respectively. Applying the stress concentration factors then the peak stress at positions 1 and 2 were calculated as 812 and 538MPa respectively. Check my workings if you don’t trust me!
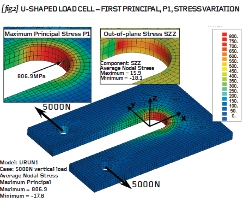
{ fig.2} shows a typical 3D analysis of the U-shaped load cell. Here 20-noded brick elements have been used to represent the complete volume of the plate with three such elements defined through the thickness of 6mm plate. (No attempt has been made to model the two obvious planes of symmetry).
Loads are applied to the two 10mm diameter bores using the “Gencoz” pressure distribution. This distribution was devised by Gencoz and his team using photo-elasticity tests (backed up with FEA) for the contact stress between a typical pin and lug assembly. If you don’t have that loading option then I suggest that you apply a constant pressure to the top half of the upper bore and the same pressure to the bottom half of the lower bore.Once the loading is complete, check that the applied pressures generate a thrust of 5kN each way and that the model, as a whole, is in force and moment equilibrium.
The peak P1 stress in the 3D model ({ fig.2}) is predicted as 807MPa and this occurs at position 1 (mid-thickness). This value agrees with the hand calculation derived using the Roark stress concentration factors (812MPa). You should find a similar result if you make such an analysis – check the Cartesian stress components too as one of them will be very similar to the peak P1 stress reported above.
One further interesting fact that we can glean from the 3D model is that the through-thickness stresses (parallel to the Z-axis) are very small compared to the peak tensile stresses reported earlier. This is because the through-thickness stress must be zero on the top and bottom faces and cannot develop significantly through the limited thickness of the 6mm plate. See the inset view on { fig.2} giving maximum and minimum values of 16 and -18MPa.
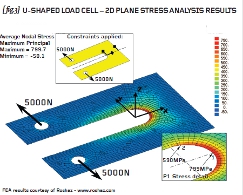
{ fig.3} shows the plane stress model of the same U-shaped load cell. We essentially collapse the 3D model in the thickness direction and construct a simple 2D model where each element is assigned a thickness value of 6mm. The plane stress approximation is, therefore, that the stresses through-thickness are zero everywhere.
Most plane stress models are built in the X-Y plane but you should check your user manual before you begin. The 10mm bores are loaded with either “Gencoz” pressure variation (as here) or the constant pressure method as described previously.
Plane stress elements, such as these, have two degrees of freedom per node – one parallel to the X-direction and one parallel to the Y-direction. The model as a whole will therefore have the freedom to translate in the X and Y directions and ROTATE about an axis parallel to the Z-axis. Given that the loads balance, and it must be an accurate balance well within 1%, then the elegant thing to do here is to select one node for X and Y constraint, and a second node for (say) Y-constraint. This second point stops the rotation about the Z-axis. See { fig.3} for the 2-1 constraints used here.
This is our first foray into constraint methods so don’t worry too much if you haven’t seen this minimum constraint technique before. More next time when we will examine how the 3D model was constrained… 
Part thirteen of an engineering masterclass: U-shaped load cell – Analysis
Default


