https://giphy.com/embed/Yllqb0TzbgrbuoO5MN
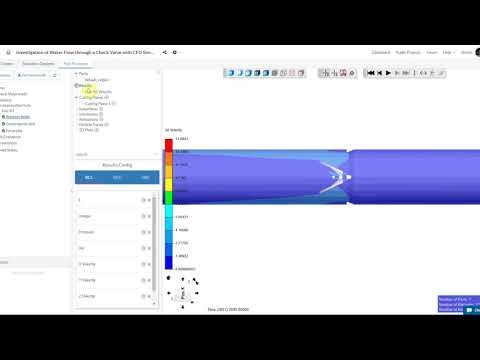
As part of its latest release SimScale has launched an improved version of its online post-processor, providing what it says are ‘faster and more powerful’ mechanisms for visualisation and interrogation of simulation results.
The new online post-processor should improve performance over the previous iteration, including speed to load, visualise and manipulate the data.
SimScale says that the new experience is ‘matching the robustness level of a desktop post-processing software with well equipped hardware’, ensuring that both quick checks on the setup and in depth post-processing can be done with as much ease as possible.

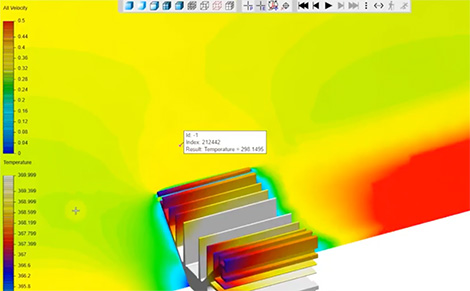
Iso-volumes and Iso surfaces can be used for visualising the 3D object based upon a fields scalar value. This is done by either selecting a value to create an iso-surface upon, or a range of values to create an iso-volume. This can be of benefit to users wanting to extensively to visualise applications including thermal plumes above a heat source using temperature, or wing tip vortex using vorticity.
New result animations for visualising both transient datasets and steady state data sets are available for the user; set by choosing a start and end time, and resolution of the animation and animating with the current visualised state. It also allows the user to visualise streamlines over time for steady state results.
The new post processor also has some enhancements to colour maps, including the option to change between several different colour schemes and the ability to choose how many colour levels are seen.
This will help in viewing multiple fields in the same visualisation, which might have once been hard to display, for example, a surface pressure visualisation can be presented using the traditional rainbow scheme.
Streamlines coloured by velocity can be visualised using a thermal scheme, giving what SimScale says is a clearer understanding of the results without confusion.
In the new post processor clicking on a surface location of which you desire the result can be used to ensure that a more complete understanding of the field without having to invest time creating more complicated visualisations.
This could prove useful in several applications, including cuts through a heat source to understand surrounding temperatures, or surface representation of a building in wind load, gaining an understanding into surface pressures.


